Latest recommendations

| Id | Title * | Authors * | Abstract * ▲ | Picture * | Thematic fields * | Recommender | Reviewers | Submission date | |
|---|---|---|---|---|---|---|---|---|---|
02 Jun 2023
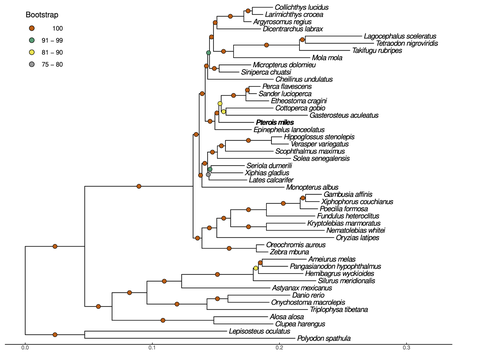
Near-chromosome level genome assembly of devil firefish, Pterois milesThe genome of a dangerous invader (fish) beautyRecommended by Iker Irisarri based on reviews by Maria Recuerda and 1 anonymous reviewer based on reviews by Maria Recuerda and 1 anonymous reviewer
High-quality genomes are currently being generated at an unprecedented speed powered by long-read sequencing technologies. However, sequencing effort is concentrated unequally across the tree of life and several key evolutionary and ecological groups remain largely unexplored. So is the case for fish species of the family Scorpaenidae (Perciformes). Kitsoulis et al. present the genome of the devil firefish, Pterois miles (1). Following current best practices, the assembly relies largely on Oxford Nanopore long reads, aided by Illumina short reads for polishing to increase the per-base accuracy. PacBio’s IsoSeq was used to sequence RNA from a variety of tissues as direct evidence for annotating genes. The reconstructed genome is 902 Mb in size and has high contiguity (N50=14.5 Mb; 660 scaffolds, 90% of the genome covered by the 83 longest scaffolds) and completeness (98% BUSCO completeness). The new genome is used to assess the phylogenetic position of P. miles, explore gene synteny against zebrafish, look at orthogroup expansion and contraction patterns in Perciformes, as well as to investigate the evolution of toxins in scorpaenid fish (2). In addition to its value for better understanding the evolution of scorpaenid and teleost fishes, this new genome is also an important resource for monitoring its invasiveness through the Mediterranean Sea (3) and the Atlantic Ocean, in the latter case forming the invasive lionfish complex with P. volitans (4). REFERENCES 1. Kitsoulis CV, Papadogiannis V, Kristoffersen JB, Kaitetzidou E, Sterioti E, Tsigenopoulos CS, Manousaki T. (2023) Near-chromosome level genome assembly of devil firefish, Pterois miles. BioRxiv, ver. 6 peer-reviewed and recommended by Peer Community in Genomics. https://doi.org/10.1101/2023.01.10.523469 2. Kiriake A, Shiomi K. (2011) Some properties and cDNA cloning of proteinaceous toxins from two species of lionfish (Pterois antennata and Pterois volitans). Toxicon, 58(6-7):494–501. https://doi.org/10.1016/j.toxicon.2011.08.010 3. Katsanevakis S, et al. (2020) Un- published Mediterranean records of marine alien and cryptogenic species. BioInvasions Records, 9:165–182. https://doi.org/10.3391/bir.2020.9.2.01 4. Lyons TJ, Tuckett QM, Hill JE. (2019) Data quality and quantity for invasive species: A case study of the lionfishes. Fish and Fisheries, 20:748–759. https://doi.org/10.1111/faf.12374 | Near-chromosome level genome assembly of devil firefish, *Pterois miles* | Christos V. Kitsoulis, Vasileios Papadogiannis, Jon B. Kristoffersen, Elisavet Kaitetzidou, Aspasia Sterioti, Costas S. Tsigenopoulos, Tereza Manousaki | <p style="text-align: justify;">Devil firefish (<em>Pterois miles</em>), a member of Scorpaenidae family, is one of the most successful marine non-native species, dominating around the world, that was rapidly spread into the Mediterranean Sea, thr... | | Evolutionary genomics | Iker Irisarri | 2023-01-17 12:37:20 | ||
12 Jul 2022
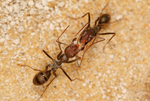
Chromosome-level genome assembly and annotation of two lineages of the ant Cataglyphis hispanica: steppingstones towards genomic studies of hybridogenesis and thermal adaptation in desert antsA genomic resource for ants, and moreRecommended by Nadia Ponts based on reviews by Isabel Almudi and Nicolas NègreThe ant species Cataglyphis hispanica is remarkably well adapted to arid habitats of the Iberian Peninsula where two hybridogenetic lineages co-occur, i.e., queens mating with males from the other lineage produce only non-reproductive hybrid workers whereas reproductive males and females are produced by parthenogenesis (Lavanchy and Schwander, 2019). For these two reasons, the genomes of these lineages, Chis1 and Chis2, are potential gold mines to explore the genetic bases of thermal adaptation and the evolution of alternative reproductive modes. Nowadays, sequencing technology enables assembling all kinds of genomes provided genomic DNA can be extracted. More difficult to achieve is high-quality assemblies with just as high-quality annotations that are readily available to the community to be used and re-used at will (Byrne et al., 2019; Salzberg, 2019). The challenge was successfully completed by Darras and colleagues, the generated resource being fully available to the community, including scripts and command lines used to obtain the proposed results. The authors particularly describe that lineage Chis2 has 27 chromosomes, against 26 or 27 for lineage Chis1, with a Robertsonian translocation identified by chromosome conformation capture (Duan et al., 2010, 2012) in the two Queens sequenced. Transcript-supported gene annotation provided 11,290 high-quality gene models. In addition, an ant-tailored annotation pipeline identified 56 different families of repetitive elements in both Chis1 and Chis2 lineages of C. hispanica spread in a little over 15 % of the genome. Altogether, the genomes of Chis1 and Chis2 are highly similar and syntenic, with some level of polymorphism raising questions about their evolutionary story timeline. In particular, the uniform distribution of polymorphisms along the genomes shakes up a previous hypothesis of hybridogenetic lineage pairs determined by ancient non-recombining regions (Linksvayer, Busch and Smith, 2013). I recommend this paper because the science behind is both solid and well-explained. The provided resource is of high quality, and accompanied by a critical exploration of the perspectives brought by the results. These genomes are excellent resources to now go further in exploring the possible events at the genome level that accompanied the remarkable thermal adaptation of the ants Cataglyphis, as well as insights into the genetics of hybridogenetic lineages. Beyond the scientific value of the resources and insights provided by the work performed, I also recommend this article because it is an excellent example of Open Science (Allen and Mehler, 2019; Sarabipour et al., 2019), all data methods and tools being fully and easily accessible to whoever wants/needs it. References Allen C, Mehler DMA (2019) Open science challenges, benefits and tips in early career and beyond. PLOS Biology, 17, e3000246. https://doi.org/10.1371/journal.pbio.3000246 Byrne A, Cole C, Volden R, Vollmers C (2019) Realizing the potential of full-length transcriptome sequencing. Philosophical Transactions of the Royal Society B: Biological Sciences, 374, 20190097. https://doi.org/10.1098/rstb.2019.0097 Darras H, de Souza Araujo N, Baudry L, Guiglielmoni N, Lorite P, Marbouty M, Rodriguez F, Arkhipova I, Koszul R, Flot J-F, Aron S (2022) Chromosome-level genome assembly and annotation of two lineages of the ant Cataglyphis hispanica: stepping stones towards genomic studies of hybridogenesis and thermal adaptation in desert ants. bioRxiv, 2022.01.07.475286, ver. 3 peer-reviewed and recommended by Peer community in Genomics. https://doi.org/10.1101/2022.01.07.475286 Duan Z, Andronescu M, Schutz K, Lee C, Shendure J, Fields S, Noble WS, Anthony Blau C (2012) A genome-wide 3C-method for characterizing the three-dimensional architectures of genomes. Methods, 58, 277–288. https://doi.org/10.1016/j.ymeth.2012.06.018 Duan Z, Andronescu M, Schutz K, McIlwain S, Kim YJ, Lee C, Shendure J, Fields S, Blau CA, Noble WS (2010) A three-dimensional model of the yeast genome. Nature, 465, 363–367. https://doi.org/10.1038/nature08973 Lavanchy G, Schwander T (2019) Hybridogenesis. Current Biology, 29, R9–R11. https://doi.org/10.1016/j.cub.2018.11.046 Linksvayer TA, Busch JW, Smith CR (2013) Social supergenes of superorganisms: Do supergenes play important roles in social evolution? BioEssays, 35, 683–689. https://doi.org/10.1002/bies.201300038 Salzberg SL (2019) Next-generation genome annotation: we still struggle to get it right. Genome Biology, 20, 92. https://doi.org/10.1186/s13059-019-1715-2 Sarabipour S, Debat HJ, Emmott E, Burgess SJ, Schwessinger B, Hensel Z (2019) On the value of preprints: An early career researcher perspective. PLOS Biology, 17, e3000151. https://doi.org/10.1371/journal.pbio.3000151 | Chromosome-level genome assembly and annotation of two lineages of the ant Cataglyphis hispanica: steppingstones towards genomic studies of hybridogenesis and thermal adaptation in desert ants | Hugo Darras, Natalia de Souza Araujo, Lyam Baudry, Nadège Guiglielmoni, Pedro Lorite, Martial Marbouty, Fernando Rodriguez, Irina Arkhipova, Romain Koszul, Jean-François Flot, Serge Aron | <p style="text-align: justify;"><em>Cataglyphis</em> are thermophilic ants that forage during the day when temperatures are highest and sometimes close to their critical thermal limit. Several Cataglyphis species have evolved unusual reproductive ... | | Evolutionary genomics | Nadia Ponts | Nicolas Nègre, Isabel Almudi | 2022-01-13 16:47:30 | |
15 Sep 2022
EukProt: A database of genome-scale predicted proteins across the diversity of eukaryotesEukProt enables reproducible Eukaryota-wide protein sequence analysesRecommended by Gavin Douglas based on reviews by 2 anonymous reviewers
Comparative genomics is a general approach for understanding how genomes differ, which can be considered from many angles. For instance, this approach can delineate how gene content varies across organisms, which can lead to novel hypotheses regarding what those organisms do. It also enables investigations into the sequence-level divergence of orthologous DNA, which can provide insight into how evolutionary forces differentially shape genome content and structure across lineages. Burki F, Roger AJ, Brown MW, Simpson AGB (2020) The New Tree of Eukaryotes. Trends in Ecology & Evolution, 35, 43–55. https://doi.org/10.1016/j.tree.2019.08.008 Richter DJ, Berney C, Strassert JFH, Poh Y-P, Herman EK, Muñoz-Gómez SA, Wideman JG, Burki F, Vargas C de (2022) EukProt: A database of genome-scale predicted proteins across the diversity of eukaryotes. bioRxiv, 2020.06.30.180687, ver. 5 peer-reviewed and recommended by Peer Community in Genomics. https://doi.org/10.1101/2020.06.30.180687 Wilkinson MD, Dumontier M, Aalbersberg IjJ, Appleton G, Axton M, Baak A, Blomberg N, Boiten J-W, da Silva Santos LB, Bourne PE, Bouwman J, Brookes AJ, Clark T, Crosas M, Dillo I, Dumon O, Edmunds S, Evelo CT, Finkers R, Gonzalez-Beltran A, Gray AJG, Groth P, Goble C, Grethe JS, Heringa J, ’t Hoen PAC, Hooft R, Kuhn T, Kok R, Kok J, Lusher SJ, Martone ME, Mons A, Packer AL, Persson B, Rocca-Serra P, Roos M, van Schaik R, Sansone S-A, Schultes E, Sengstag T, Slater T, Strawn G, Swertz MA, Thompson M, van der Lei J, van Mulligen E, Velterop J, Waagmeester A, Wittenburg P, Wolstencroft K, Zhao J, Mons B (2016) The FAIR Guiding Principles for scientific data management and stewardship. Scientific Data, 3, 160018. https://doi.org/10.1038/sdata.2016.18 | EukProt: A database of genome-scale predicted proteins across the diversity of eukaryotes | Daniel J. Richter, Cédric Berney, Jürgen F. H. Strassert, Yu-Ping Poh, Emily K. Herman, Sergio A. Muñoz-Gómez, Jeremy G. Wideman, Fabien Burki, Colomban de Vargas | <p style="text-align: justify;">EukProt is a database of published and publicly available predicted protein sets selected to represent the breadth of eukaryotic diversity, currently including 993 species from all major supergroups as well as orpha... | | Bioinformatics, Evolutionary genomics | Gavin Douglas | 2022-06-08 14:19:28 | ||
13 Jul 2022
Nucleosome patterns in four plant pathogenic fungi with contrasted genome structuresGenome-wide chromatin and expression datasets of various pathogenic ascomycetesRecommended by Sébastien Bloyer and Romain Koszul based on reviews by Ricardo C. Rodríguez de la Vega and 1 anonymous reviewerPlant pathogenic fungi represent serious economic threats. These organisms are rapidly adaptable, with plastic genomes containing many variable regions and evolving rapidly. It is, therefore, useful to characterize their genetic regulation in order to improve their control. One of the steps to do this is to obtain omics data that link their DNA structure and gene expression. Clairet C, Lapalu N, Simon A, Soyer JL, Viaud M, Zehraoui E, Dalmais B, Fudal I, Ponts N (2022) Nucleosome patterns in four plant pathogenic fungi with contrasted genome structures. bioRxiv, 2021.04.16.439968, ver. 4 peer-reviewed and recommended by Peer Community in Genomics. https://doi.org/10.1101/2021.04.16.439968 | Nucleosome patterns in four plant pathogenic fungi with contrasted genome structures | Colin Clairet, Nicolas Lapalu, Adeline Simon, Jessica L. Soyer, Muriel Viaud, Enric Zehraoui, Berengere Dalmais, Isabelle Fudal, Nadia Ponts | <p style="text-align: justify;">Fungal pathogens represent a serious threat towards agriculture, health, and environment. Control of fungal diseases on crops necessitates a global understanding of fungal pathogenicity determinants and their expres... | | Epigenomics, Fungi | Sébastien Bloyer | 2021-04-17 10:32:41 | ||
07 Oct 2021
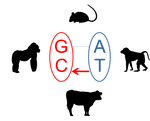
Fine-scale quantification of GC-biased gene conversion intensity in mammalsA systematic approach to the study of GC-biased gene conversion in mammalsRecommended by Carina Farah Mugal based on reviews by Fanny Pouyet , David Castellano and 1 anonymous reviewerThe role of GC-biased gene conversion (gBGC) in molecular evolution has interested scientists for the last two decades since its discovery in 1999 (Eyre-Walker 1999; Galtier et al. 2001). gBGC is a process that is associated with meiotic recombination, and is characterized by a transmission distortion in favor of G and C over A and T alleles at GC/AT heterozygous sites that occur in the vicinity of recombination-inducing double-strand breaks (Duret and Galtier 2009; Mugal et al. 2015). This transmission distortion results in a fixation bias of G and C alleles, equivalent to directional selection for G and C (Nagylaki 1983). The fixation bias subsequently leads to a correlation between recombination rate and GC content across the genome, which has served as indirect evidence for the prevalence of gBGC in many organisms. The fixation bias also produces shifts in the allele frequency spectrum (AFS) towards higher frequencies of G and C alleles. These molecular signatures of gBGC provide a means to quantify the strength of gBGC and study its variation among species and across the genome. Following this idea, first Lartillot (2013) and Capra et al. (2013) developed phylogenetic methodology to quantify gBGC based on substitutions, and De Maio et al. (2013) combined information on polymorphism into a phylogenetic setting. Complementary to the phylogenetic methods, later Glemin et al. (2015) developed a method that draws information solely from polymorphism data and the shape of the AFS. Application of these methods to primates (Capra et al. 2013; De Maio et al. 2013; Glemin et al. 2015) and mammals (Lartillot 2013) supported the notion that variation in the strength of gBGC across the genome reflects the dynamics of the recombination landscape, while variation among species correlates with proxies of the effective population size. However, application of the polymorphism-based method by Glemin et al. (2015) to distantly related Metazoa did not confirm the correlation with effective population size (Galtier et al. 2018). Here, Galtier (2021) introduces a novel phylogenetic approach applicable to the study of closely related species. Specifically, Galtier introduces a statistical framework that enables the systematic study of variation in the strength of gBGC among species and among genes. In addition, Galtier assesses fine-scale variation of gBGC across the genome by means of spatial autocorrelation analysis. This puts Galtier in a position to study variation in the strength of gBGC at three different scales, i) among species, ii) among genes, and iii) within genes. Galtier applies his method to four families of mammals, Hominidae, Cercopithecidae, Bovidae, and Muridae and provides a thorough discussion of his findings and methodology. Galtier found that the strength of gBGC correlates with proxies of the effective population size (Ne), but that the slope of the relationship differs among the four families of mammals. Given the relationship between the population-scaled strength of gBGC B = 4Neb, this finding suggests that the conversion bias (b) could vary among mammalian species. Variation in b could either result from differences in the strength of the transmission distortion (Galtier et al. 2018) or evolutionary changes in the rate of recombination (Boman et al. 2021). Alternatively, Galtier suggests that also systematic variation in proxies of Ne could lead to similar observations. Finally, the present study reports intriguing inter-species differences between the extent of variation in the strength of gBGC among and within genes, which are interpreted in consideration of the recombination dynamics in mammals. References Boman J, Mugal CF, Backström N (2021) The Effects of GC-Biased Gene Conversion on Patterns of Genetic Diversity among and across Butterfly Genomes. Genome Biology and Evolution, 13. https://doi.org/10.1093/gbe/evab064 Capra JA, Hubisz MJ, Kostka D, Pollard KS, Siepel A (2013) A Model-Based Analysis of GC-Biased Gene Conversion in the Human and Chimpanzee Genomes. PLOS Genetics, 9, e1003684. https://doi.org/10.1371/journal.pgen.1003684 De Maio N, Schlötterer C, Kosiol C (2013) Linking Great Apes Genome Evolution across Time Scales Using Polymorphism-Aware Phylogenetic Models. Molecular Biology and Evolution, 30, 2249–2262. https://doi.org/10.1093/molbev/mst131 Duret L, Galtier N (2009) Biased Gene Conversion and the Evolution of Mammalian Genomic Landscapes. Annual Review of Genomics and Human Genetics, 10, 285–311. https://doi.org/10.1146/annurev-genom-082908-150001 Eyre-Walker A (1999) Evidence of Selection on Silent Site Base Composition in Mammals: Potential Implications for the Evolution of Isochores and Junk DNA. Genetics, 152, 675–683. https://doi.org/10.1093/genetics/152.2.675 Galtier N (2021) Fine-scale quantification of GC-biased gene conversion intensity in mammals. bioRxiv, 2021.05.05.442789, ver. 5 peer-reviewed and recommended by Peer Community in Genomics. https://doi.org/10.1101/2021.05.05.442789 Galtier N, Piganeau G, Mouchiroud D, Duret L (2001) GC-Content Evolution in Mammalian Genomes: The Biased Gene Conversion Hypothesis. Genetics, 159, 907–911. https://doi.org/10.1093/genetics/159.2.907 Galtier N, Roux C, Rousselle M, Romiguier J, Figuet E, Glémin S, Bierne N, Duret L (2018) Codon Usage Bias in Animals: Disentangling the Effects of Natural Selection, Effective Population Size, and GC-Biased Gene Conversion. Molecular Biology and Evolution, 35, 1092–1103. https://doi.org/10.1093/molbev/msy015 Glémin S, Arndt PF, Messer PW, Petrov D, Galtier N, Duret L (2015) Quantification of GC-biased gene conversion in the human genome. Genome Research, 25, 1215–1228. https://doi.org/10.1101/gr.185488.114 Lartillot N (2013) Phylogenetic Patterns of GC-Biased Gene Conversion in Placental Mammals and the Evolutionary Dynamics of Recombination Landscapes. Molecular Biology and Evolution, 30, 489–502. https://doi.org/10.1093/molbev/mss239 Mugal CF, Weber CC, Ellegren H (2015) GC-biased gene conversion links the recombination landscape and demography to genomic base composition. BioEssays, 37, 1317–1326. https://doi.org/10.1002/bies.201500058 Nagylaki T (1983) Evolution of a finite population under gene conversion. Proceedings of the National Academy of Sciences, 80, 6278–6281. https://doi.org/10.1073/pnas.80.20.6278 | Fine-scale quantification of GC-biased gene conversion intensity in mammals | Nicolas Galtier | <p style="text-align: justify;">GC-biased gene conversion (gBGC) is a molecular evolutionary force that favours GC over AT alleles irrespective of their fitness effect. Quantifying the variation in time and across genomes of its intensity is key t... | | Evolutionary genomics, Population genomics, Vertebrates | Carina Farah Mugal | 2021-05-25 09:25:52 | ||
13 Jul 2022
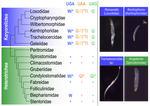
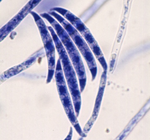
Karyorelict ciliates use an ambiguous genetic code with context-dependent stop/sense codonsAn accident frozen in time: the ambiguous stop/sense genetic code of karyorelict ciliatesRecommended by Iker Irisarri based on reviews by Vittorio Boscaro and 2 anonymous reviewers
Several variations of the “universal” genetic code are known. Among the most striking are those where a codon can either encode for an amino acid or a stop signal depending on the context. Such ambiguous codes are known to have evolved in eukaryotes multiple times independently, particularly in ciliates – eight different codes have so far been discovered (1). We generally view such genetic codes are rare ‘variants’ of the standard code restricted to single species or strains, but this might as well reflect a lack of study of closely related species. In this study, Seah and co-authors (2) explore the possibility of codon reassignment in karyorelict ciliates closely related to Parduczia sp., which has been shown to contain an ambiguous genetic code (1). Here, single-cell transcriptomics are used, along with similar available data, to explore the possibility of codon reassignment across the diversity of Karyorelictea (four out of the six recognized families). Codon reassignments were inferred from their frequencies within conserved Pfam (3) protein domains, whereas stop codons were inferred from full-length transcripts with intact 3’-UTRs. Results show the reassignment of UAA and UAG stop codons to code for glutamine (Q) and the reassignment of the UGA stop codon into tryptophan (W). This occurs only within the coding sequences, whereas the end of transcription is marked by UGA as the main stop codon, and to a lesser extent by UAA. In agreement with a previous model proposed that explains the functioning of ambiguous codes (1,4), the authors observe a depletion of in-frame UGAs before the UGA codon that indicates the stop, thus avoiding premature termination of transcription. The inferred codon reassignments occur in all studied karyorelicts, including the previously studied Parduczia sp. Despite the overall clear picture, some questions remain. Data for two out of six main karyorelict lineages are so far absent and the available data for Cryptopharyngidae was inconclusive; the phylogenetic affinities of Cryptopharyngidae have also been questioned (5). This indicates the need for further study of this interesting group of organisms. As nicely discussed by the authors, experimental evidence could further strengthen the conclusions of this paper, including ribosome profiling, mass spectrometry – as done for Condylostoma (1) – or even direct genetic manipulation. The uniformity of the ambiguous genetic code across karyorelicts might at first seem dull, but when viewed in a phylogenetic context character distribution strongly suggest that this genetic code has an ancient origin in the karyorelict ancestor ~455 Ma in the Proterozoic (6). This ambiguous code is also not a rarity of some obscure species, but it is shared by ciliates that are very diverse and ecologically important. The origin of the karyorelict code is also intriguing. Adaptive arguments suggest that it could confer robustness to mutations causing premature stop codons. However, we lack evidence for ambiguous codes being linked to specific habitats of lifestyles that could account for it. Instead, the authors favor the neutral view of an ancient “frozen accident”, fixed stochastically simply because it did not pose a significant selective disadvantage. Once a stop codon is reassigned to an amino acid, it is increasingly difficult to revert this without the deleterious effect of prematurely terminating translation. At the end, the origin of the genetic code itself is thought to be a frozen accident too (7). References 1. Swart EC, Serra V, Petroni G, Nowacki M. Genetic codes with no dedicated stop codon: Context-dependent translation termination. Cell 2016;166: 691–702. https://doi.org/10.1016/j.cell.2016.06.020 2. Seah BKB, Singh A, Swart EC (2022) Karyorelict ciliates use an ambiguous genetic code with context-dependent stop/sense codons. bioRxiv, 2022.04.12.488043. ver. 4 peer-reviewed and recommended by Peer Community in Genomics. https://doi.org/10.1101/2022.04.12.488043 3. Mistry J, Chuguransky S, Williams L, Qureshi M, Salazar GA, Sonnhammer ELL, Tosatto SCE, Paladin L, Raj S, Richardson LJ, Finn RD, Bateman A. Pfam: The protein families database in 2021, Nuc Acids Res 2020;49: D412-D419. https://doi.org/10.1093/nar/gkaa913 4. Alkalaeva E, Mikhailova T. Reassigning stop codons via translation termination: How a few eukaryotes broke the dogma. Bioessays. 2017;39. https://doi.org/10.1002/bies.201600213 5. Xu Y, Li J, Song W, Warren A. Phylogeny and establishment of a new ciliate family, Wilbertomorphidae fam. nov. (Ciliophora, Karyorelictea), a highly specialized taxon represented by Wilbertomorpha colpoda gen. nov., spec. nov. J Eukaryot Microbiol. 2013;60: 480–489. https://doi.org/10.1111/jeu.12055 6. Fernandes NM, Schrago CG. A multigene timescale and diversification dynamics of Ciliophora evolution. Mol Phylogenet Evol. 2019;139: 106521. https://doi.org/10.1016/j.ympev.2019.106521 7. Crick FH. The origin of the genetic code. J Mol Biol. 1968;38: 367–379. https://doi.org/10.1016/0022-2836(68)90392-6 | Karyorelict ciliates use an ambiguous genetic code with context-dependent stop/sense codons | Brandon Kwee Boon Seah, Aditi Singh, Estienne Carl Swart | <p style="text-align: justify;">In ambiguous stop/sense genetic codes, the stop codon(s) not only terminate translation but can also encode amino acids. Such codes have evolved at least four times in eukaryotes, twice among ciliates (<em>Condylost... | | Bioinformatics, Evolutionary genomics | Iker Irisarri | 2022-05-02 11:06:10 | ||
24 Feb 2023
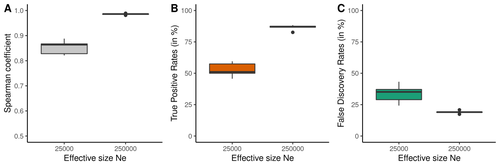
Performance and limitations of linkage-disequilibrium-based methods for inferring the genomic landscape of recombination and detecting hotspots: a simulation studyHow to interpret the inference of recombination landscapes on methods based on linkage disequilibrium?Recommended by Sebastian Ernesto Ramos-Onsins based on reviews by 2 anonymous reviewers
Data interpretation depends on previously established and validated tools, designed for a specific type of data. These methods, however, are usually based on simple models with validity subject to a set of theoretical parameterized conditions and data types. Accordingly, the tool developers provide the potential users with guidelines for data interpretations within the tools’ limitation. Nevertheless, once the methodology is accepted by the community, it is employed in a large variety of empirical studies outside of the method’s original scope or that typically depart from the standard models used for its design, thus potentially leading to the wrong interpretation of the results. Numerous empirical studies inferred recombination rates across genomes, detecting hotspots of recombination and comparing related species (e.g., Shanfelter et al. 2019, Spence and Song 2019). These studies used indirect methodologies based on the signals that recombination left in the genome, such as linkage disequilibrium and the patterns of haplotype segregation (e.g.,Chan et al. 2012). The conclusions from these analyses have been used, for example, to interpret the evolution of the chromosomal structure or the evolution of recombination among closely related species. Indirect methods have the advantage of collecting a large quantity of recombination events, and thus have a better resolution than direct methods (which only detect the few recombination events occurring at that time). On the other hand, indirect methods are affected by many different evolutionary events, such as demographic changes and selection. Indeed, the inference of recombination levels across the genome has not been studied accurately in non-standard conditions. Linkage disequilibrium is affected by several factors that can modify the recombination inference, such as demographic history, events of selection, population size, and mutation rate, but is also related to the size of the studied sample, and other technical parameters defined for each specific methodology. Raynaud et al (2023) analyzed the reliability of the recombination rate inference when considering the violation of several standard assumptions (evolutionary and methodological) in one of the most popular families of methods based on LDhat (McVean et al. 2004), specifically its improved version, LDhelmet (Chan et al. 2012). These methods cover around 70 % of the studies that infer recombination rates. The authors used recombination maps, obtained from empirical studies on humans, and included hotspots, to perform a detailed simulation study of the capacity of this methodology to correctly infer the pattern of recombination and the location of these hotspots. Correlations between the real, and inferred values from simulations were obtained, as well as several rates, such as the true positive and false discovery rate to detect hotspots. The authors of this work send a message of caution to researchers that are applying this methodology to interpret data from the inference of recombination landscapes and the location of hotspots. The inference of recombination landscapes and hotspots can differ considerably even in standard model conditions. In addition, demographic processes, like bottleneck or admixture, but also the level of population size and mutation rates, can substantially affect the estimation accuracy of the level of recombination and the location of hotspots. Indeed, the inference of the location of hotspots in simulated data with the same landscape, can be very imprecise when standard assumptions are violated or not considered. These effects may lead to incorrect interpretations, for example about the conservation of recombination maps between closely related species. Finally, Raynaud et al (2023) included a useful guide with advice on how to obtain accurate recombination estimations with methods based on linkage disequilibrium, also emphasizing the limitations of such approaches. REFERENCES Chan AH, Jenkins PA, Song YS (2012) Genome-Wide Fine-Scale Recombination Rate Variation in Drosophila melanogaster. PLOS Genetics, 8, e1003090. https://doi.org/10.1371/journal.pgen.1003090 McVean GAT, Myers SR, Hunt S, Deloukas P, Bentley DR, Donnelly P (2004) The Fine-Scale Structure of Recombination Rate Variation in the Human Genome. Science, 304, 581–584. https://doi.org/10.1126/science.1092500 Raynaud M, Gagnaire P-A, Galtier N (2023) Performance and limitations of linkage-disequilibrium-based methods for inferring the genomic landscape of recombination and detecting hotspots: a simulation study. bioRxiv, 2022.03.30.486352, ver. 2 peer-reviewed and recommended by Peer Community in Genomics. https://doi.org/10.1101/2022.03.30.486352 Spence JP, Song YS (2019) Inference and analysis of population-specific fine-scale recombination maps across 26 diverse human populations. Science Advances, 5, eaaw9206. https://doi.org/10.1126/sciadv.aaw9206 | Performance and limitations of linkage-disequilibrium-based methods for inferring the genomic landscape of recombination and detecting hotspots: a simulation study | Marie Raynaud, Pierre-Alexandre Gagnaire, Nicolas Galtier | <p style="text-align: justify;">Knowledge of recombination rate variation along the genome provides important insights into genome and phenotypic evolution. Population genomic approaches offer an attractive way to infer the population-scaled recom... | | Bioinformatics, Evolutionary genomics, Population genomics | Sebastian Ernesto Ramos-Onsins | 2022-04-05 14:59:14 | ||
08 Apr 2022

POSTPRINT
Phylogenetics in the Genomic Era“Phylogenetics in the Genomic Era” brings together experts in the field to present a comprehensive synthesisRecommended by Robert Waterhouse and Karen MeusemannE-book: Phylogenetics in the Genomic Era (Scornavacca et al. 2021) This book was not peer-reviewed by PCI Genomics. It has undergone an internal review by the editors. Accurate reconstructions of the relationships amongst species and the genes encoded in their genomes are an essential foundation for almost all evolutionary inferences emerging from downstream analyses. Molecular phylogenetics has developed as a field over many decades to build suites of models and methods to reconstruct reliable trees that explain, support, or refute such inferences. The genomic era has brought new challenges and opportunities to the field, opening up new areas of research and algorithm development to take advantage of the accumulating large-scale data. Such ‘big-data’ phylogenetics has come to be known as phylogenomics, which broadly aims to connect molecular and evolutionary biology research to address questions centred on relationships amongst taxa, mechanisms of molecular evolution, and the biological functions of genes and other genomic elements. This book brings together experts in the field to present a comprehensive synthesis of Phylogenetics in the Genomic Era, covering key conceptual and methodological aspects of how to build accurate phylogenies and how to apply them in molecular and evolutionary research. The paragraphs below briefly summarise the five constituent parts of the book, highlighting the key concepts, methods, and applications that each part addresses. Being organised in an accessible style, while presenting details to provide depth where necessary, and including guides describing real-world examples of major phylogenomic tools, this collection represents an invaluable resource, particularly for students and newcomers to the field of phylogenomics. Part 1: Phylogenetic analyses in the genomic era Modelling how sequences evolve is a fundamental cornerstone of phylogenetic reconstructions. This part of the book introduces the reader to phylogenetic inference methods and algorithmic optimisations in the contexts of Markov, Maximum Likelihood, and Bayesian models of sequence evolution. The main concepts and theoretical considerations are mapped out for probabilistic Markov models, efficient tree building with Maximum Likelihood methods, and the flexibility and robustness of Bayesian approaches. These are supported with practical examples of phylogenomic applications using the popular tools RAxML and PhyloBayes. By considering theoretical, algorithmic, and practical aspects, these chapters provide readers with a holistic overview of the challenges and recent advances in developing scalable phylogenetic analyses in the genomic era. Part 2: Data quality, model adequacy This part focuses on the importance of considering the appropriateness of the evolutionary models used and the accuracy of the underlying molecular and genomic data. Both these aspects can profoundly affect the results when applying current phylogenomic methods to make inferences about complex biological and evolutionary processes. A clear example is presented for methods for building multiple sequence alignments and subsequent filtering approaches that can greatly impact phylogeny inference. The importance of error detection in (meta)barcode sequencing data is also highlighted, with solutions offered by the MACSE_BARCODE pipeline for accurate taxonomic assignments. Orthology datasets are essential markers for phylogenomic inferences, but the overview of concepts and methods presented shows that they too face challenges with respect to model selection and data quality. Finally, an innovative approach using ancestral gene order reconstructions provides new perspectives on how to assess gene tree accuracy for phylogenomic analyses. By emphasising through examples the importance of using appropriate evolutionary models and assessing input data quality, these chapters alert readers to key limitations that the field as a whole strives to address. Part 3: Resolving phylogenomic conflicts Conflicting phylogenetic signals are commonplace and may derive from statistical or systematic bias. This part of the book addresses possible causes of conflict, discordance between gene trees and species trees and how processes that lead to such conflicts can be described by phylogenetic models. Furthermore, it provides an overview of various models and methods with examples in phylogenomics including their pros and cons. Outlined in detail is the multispecies coalescent model (MSC) and its applications in phylogenomics. An interesting aspect is that different phylogenetic signals leading to conflict are in fact a key source of information rather than a problem that can – and should – be used to point to events like introgression or hybridisation, highlighting possible future trends in this research area. Last but not least, this part of the book also addresses inferring species trees by concatenating single multiple sequence alignments (gene alignments) versus inferring the species tree based on ensembles of single gene trees pointing out advantages and disadvantages of both approaches. As an important take home message from these chapters, it is recommended to be flexible and identify the most appropriate approach for each dataset to be analysed since this may tremendously differ depending on the dataset, setting, taxa, and phylogenetic level addressed by the researcher. Part 4: Functional evolutionary genomics In this part of the book the focus shifts to functional considerations of phylogenomics approaches both in terms of molecular evolution and adaptation and with respect to gene expression. The utility of multi-species analysis is clearly presented in the context of annotating functional genomic elements through quantifying evolutionary constraint and protein-coding potential. An historical perspective on characterising rates of change highlights how phylogenomic datasets help to understand the modes of molecular evolution across the genome, over time, and between lineages. These are contextualised with respect to the specific aim of detecting signatures of adaptation from protein-coding DNA alignments using the example of the MutSelDP-ω∗ model. This is extended with the presentation of the generally rare case of adaptive sequence convergence, where consideration of appropriate models and knowledge of gene functions and phenotypic effects are needed. Constrained or relaxed, selection pressures on sequence or copy-number affect genomic elements in different ways, making the very concept of function difficult to pin down despite it being fundamental to relate the genome to the phenotype and organismal fitness. Here gene expression provides a measurable intermediate, for which the Expression Comparison tool from the Bgee suite allows exploration of expression patterns across multiple animal species taking into account anatomical homology. Overall, phylogenomics applications in functional evolutionary genomics build on a rich theoretical history from molecular analyses where integration with knowledge of gene functions is challenging but critical. Part 5: Phylogenomic applications Rather than attempting to review the full extent of applications linked to phylogenomics, this part of the book focuses on providing detailed specific insights into selected examples and methods concerning i) estimating divergence times, and ii) species delimitation in the era of ‘omics’ data. With respect to estimating divergence times, an exemplary overview is provided for fossil data recovered from geological records, either using fossil data as calibration points with an extant-species-inferred phylogeny, or using a fossilised birth-death process as a mechanistic model that accounts for lineage diversification. Included is a tutorial for a joint approach to infer phylogenies and estimate divergence times using the RevBayes software with various models implemented for different applications and datasets incorporating molecular and morphological data. An interesting excursion is outlined focusing on timescale estimates with respect to viral evolution introducing BEAGLE, a high-performance likelihood-calculation platform that can be used on multi-core systems. As a second major subject, species delimitation is addressed since currently the increasing amount of available genomic data enables extensive inferences, for instance about the degree of genetic isolation among species and ancient and recent introgression events. Describing the history of molecular species delimitation up to the current genomic era and presenting widely used computational methods incorporating single- and multi-locus genomic data, pros and cons are addressed. Finally, a proposal for a new method for delimiting species based on empirical criteria is outlined. In the closing chapter of this part of the book, BPP (Bayesian Markov chain Monte Carlo program) for analysing multi-locus sequence data under the multispecies coalescent (MSC) model with and without introgression is introduced, including a tutorial. These examples together provide accessible details on key conceptual and methodological aspects related to the application of phylogenetics in the genomic era. References Scornavacca C, Delsuc F, Galtier N (2021) Phylogenetics in the Genomic Era. https://hal.inria.fr/PGE/ | Phylogenetics in the Genomic Era | Céline Scornavacca, Frédéric Delsuc, Nicolas Galtier | <p style="text-align: justify;">Molecular phylogenetics was born in the middle of the 20th century, when the advent of protein and DNA sequencing offered a novel way to study the evolutionary relationships between living organisms. The first 50 ye... | | Bacteria and archaea, Bioinformatics, Evolutionary genomics, Functional genomics, Fungi, Plants, Population genomics, Vertebrates, Viruses and transposable elements | Robert Waterhouse | 2022-03-15 17:43:52 | ||
06 May 2022
A deep dive into genome assemblies of non-vertebrate animalsDiving, and even digging, into the wild jungle of annotation pathways for non-vertebrate animalsRecommended by Francois Sabot based on reviews by Yann Bourgeois, Cécile Monat, Valentina Peona and Benjamin Istace
In their paper, Guiglielmoni et al. propose we pick up our snorkels and palms and take "A deep dive into genome assemblies of non-vertebrate animals" (1). Indeed, while numerous assembly-related tools were developed and tested for human genomes (or at least vertebrates such as mice), very few were tested on non-vertebrate animals so far. Moreover, most of the benchmarks are aimed at raw assembly tools, and very few offer a guide from raw reads to an almost finished assembly, including quality control and phasing. This huge and exhaustive review starts with an overview of the current sequencing technologies, followed by the theory of the different approaches for assembly and their implementation. For each approach, the authors present some of the most representative tools, as well as the limits of the approach. The authors additionally present all the steps required to obtain an almost complete assembly at a chromosome-scale, with all the different technologies currently available for scaffolding, QC, and phasing, and the way these tools can be applied to non-vertebrates animals. Finally, they propose some useful advice on the choice of the different approaches (but not always tools, see below), and advocate for a robust genome database with all information on the way the assembly was obtained. This review is a very complete one for now and is a very good starting point for any student or scientist interested to start working on genome assembly, from either model or non-model organisms. However, the authors do not provide a list of tools or a benchmark of them as a recommendation. Why? Because such a proposal may be obsolete in less than a year.... Indeed, with the explosion of the 3rd generation of sequencing technology, assembly tools (from different steps) are constantly evolving, and their relative performance increases on a monthly basis. In addition, some tools are really efficient at the time of a review or of an article, but are not further developed later on, and thus will not evolve with the technology. We have all seen it with wonderful tools such as Chiron (2) or TopHat (3), which were very promising ones, but cannot be developed further due to the stop of the project, the end of the contract of the post-doc in charge of the development, or the decision of the developer to switch to another paradigm. Such advice would, therefore, need to be constantly updated. Thus, the manuscript from Guiglielmoni et al will be an almost intemporal one (up to the next sequencing revolution at last), and as they advocated for a more informed genome database, I think we should consider a rolling benchmarking system (tools, genome and sequence dataset) allowing to keep the performance of the tools up-to-date, and to propose the best set of assembly tools for a given type of genome. References 1. Guiglielmoni N, Rivera-Vicéns R, Koszul R, Flot J-F (2022) A Deep Dive into Genome Assemblies of Non-vertebrate Animals. Preprints, 2021110170, ver. 3 peer-reviewed and recommended by Peer Community in Genomics. https://doi.org/10.20944/preprints202111.0170 2. Teng H, Cao MD, Hall MB, Duarte T, Wang S, Coin LJM (2018) Chiron: translating nanopore raw signal directly into nucleotide sequence using deep learning. GigaScience, 7, giy037. https://doi.org/10.1093/gigascience/giy037 3. Trapnell C, Pachter L, Salzberg SL (2009) TopHat: discovering splice junctions with RNA-Seq. Bioinformatics, 25, 1105–1111. https://doi.org/10.1093/bioinformatics/btp120 | A deep dive into genome assemblies of non-vertebrate animals | Nadège Guiglielmoni, Ramón Rivera-Vicéns, Romain Koszul, Jean-François Flot | <p style="text-align: justify;">Non-vertebrate species represent about ∼95% of known metazoan (animal) diversity. They remain to this day relatively unexplored genetically, but understanding their genome structure and function is pivotal for expan... | | Bioinformatics, Evolutionary genomics | Francois Sabot | Valentina Peona, Benjamin Istace, Cécile Monat, Yann Bourgeois | 2021-11-10 17:47:31 | |
11 Sep 2023
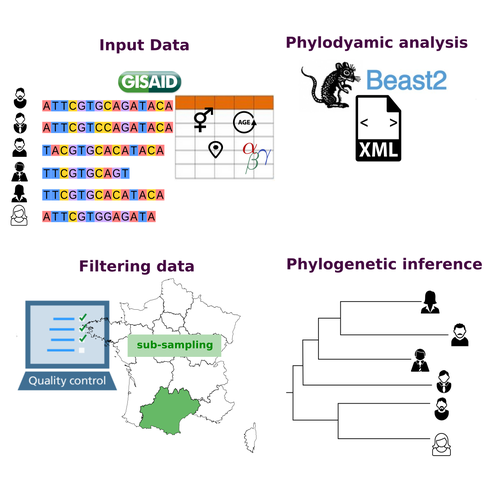
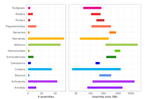
COVFlow: phylodynamics analyses of viruses from selected SARS-CoV-2 genome sequencesA pipeline to select SARS-CoV-2 sequences for reliable phylodynamic analysesRecommended by Emmanuelle Lerat based on reviews by Gabriel Wallau and Bastien BoussauPhylodynamic approaches enable viral genetic variation to be tracked over time, providing insight into pathogen phylogenetic relationships and epidemiological dynamics. These are important methods for monitoring viral spread, and identifying important parameters such as transmission rate, geographic origin and duration of infection [1]. This knowledge makes it possible to adjust public health measures in real-time and was important in the case of the COVID-19 pandemic [2]. However, these approaches can be complicated to use when combining a very large number of sequences. This was particularly true during the COVID-19 pandemic, when sequencing data representing millions of entire viral genomes was generated, with associated metadata enabling their precise identification. Danesh et al. [3] present a bioinformatics pipeline, CovFlow, for selecting relevant sequences according to user-defined criteria to produce files that can be used directly for phylodynamic analyses. The selection of sequences first involves a quality filter on the size of the sequences and the absence of unresolved bases before being able to make choices based on the associated metadata. Once the sequences are selected, they are aligned and a time-scaled phylogenetic tree is inferred. An output file in a format directly usable by BEAST 2 [4] is finally generated. To illustrate the use of the pipeline, Danesh et al. [3] present an analysis of the Delta variant in two regions of France. They observed a delay in the start of the epidemic depending on the region. In addition, they identified genetic variation linked to the start of the school year and the extension of vaccination, as well as the arrival of a new variant. This tool will be of major interest to researchers analysing SARS-CoV-2 sequencing data, and a number of future developments are planned by the authors. References [1] Baele G, Dellicour S, Suchard MA, Lemey P, Vrancken B. 2018. Recent advances in computational phylodynamics. Curr Opin Virol. 31:24-32. https://doi.org/10.1016/j.coviro.2018.08.009 [2] Attwood SW, Hill SC, Aanensen DM, Connor TR, Pybus OG. 2022. Phylogenetic and phylodynamic approaches to understanding and combating the early SARS-CoV-2 pandemic. Nat Rev Genet. 23:547-562. https://doi.org/10.1038/s41576-022-00483-8 [3] Danesh G, Boennec C, Verdurme L, Roussel M, Trombert-Paolantoni S, Visseaux B, Haim-Boukobza S, Alizon S. 2023. COVFlow: phylodynamics analyses of viruses from selected SARS-CoV-2 genome sequences. bioRxiv, ver. 7 peer-reviewed and recommended by Peer Community in Genomics. https://doi.org/10.1101/2022.06.17.496544 [4] Bouckaert R, Heled J, Kühnert D, Vaughan T, Wu C-H et al. 2014. BEAST 2: a software platform for Bayesian evolutionary analysis. PLoS Comput Biol 10: e1003537. https://doi.org/10.1371/journal.pcbi.1003537 | COVFlow: phylodynamics analyses of viruses from selected SARS-CoV-2 genome sequences | Gonché Danesh, Corentin Boennec, Laura Verdurme, Mathilde Roussel, Sabine Trombert-Paolantoni, Benoit Visseaux, Stephanie Haim-Boukobza, Samuel Alizon | <p style="text-align: justify;">Phylodynamic analyses generate important and timely data to optimise public health response to SARS-CoV-2 outbreaks and epidemics. However, their implementation is hampered by the massive amount of sequence data and... | | Bioinformatics, Evolutionary genomics | Emmanuelle Lerat | 2022-12-12 09:04:01 |


