
Natural variation and adaptation in Brachypodium distachyon
The demographic history of the wild crop relative Brachypodium distachyon is shaped by distinct past and present ecological niches
Abstract
Recommendation: posted 31 August 2023, validated 07 September 2023
Casacuberta, J. (2023) Natural variation and adaptation in Brachypodium distachyon. Peer Community in Genomics, 100251. https://doi.org/10.24072/pci.genomics.100251
Recommendation
Identifying the genetic factors that allow plant adaptation is a major scientific question that is particularly relevant in the face of the climate change that we are already experiencing. To address this, it is essential to have genetic information on a high number of accessions (i.e., plants registered with unique accession numbers) growing under contrasting environmental conditions. There is already an important number of studies addressing these issues in the plant Arabidopsis thaliana, but there is a need to expand these analyses to species that play key roles in wild ecosystems and are close to very relevant crops, as is the case of grasses.
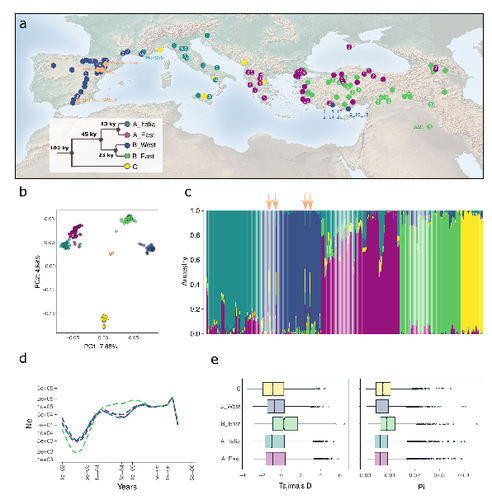
The work of Minadakis, Roulin and co-workers (1) presents a Brachypodium distachyon panel of 332 fully sequences accessions that covers the whole species distribution across a wide range of bioclimatic conditions, which will be an invaluable tool to fill this gap. In addition, the authors use this data to start analyzing the population structure and demographic history of this plant, suggesting that the species experienced a shift of its distribution following the Last Glacial Maximum, which may have forced the species into new habitats. The authors also present a modeling of the niches occupied by B. distachyon together with an analysis of the genetic clades found in each of them, and start analyzing the different adaptive loci that may have allowed the species’ expansion into different bioclimatic areas.
In addition to the importance of the resources made available by the authors for the scientific community, the analyses presented are well done and carefully discussed, and they highlight the potential of these new resources to investigate the genetic bases of plant adaptation.
References
1. Nikolaos Minadakis, Hefin Williams, Robert Horvath, Danka Caković, Christoph Stritt, Michael Thieme, Yann Bourgeois, Anne C. Roulin. The demographic history of the wild crop relative Brachypodium distachyon is shaped by distinct past and present ecological niches. bioRxiv, 2023.06.01.543285, ver. 5 peer-reviewed and recommended by Peer Community in Genomics. https://doi.org/10.1101/2023.06.01.543285

The recommender in charge of the evaluation of the article and the reviewers declared that they have no conflict of interest (as defined in the code of conduct of PCI) with the authors or with the content of the article. The authors declared that they comply with the PCI rule of having no financial conflicts of interest in relation to the content of the article.
Swiss National Fund, University of Zurich
Evaluation round #1
DOI or URL of the preprint: https://doi.org/10.1101/2023.06.01.543285
Version of the preprint: 3
Author's Reply, 19 Aug 2023
Dear Josep,
We are hereby submitting in new version of our mansucript. The updated version is available on bioarchive https://www.biorxiv.org/content/10.1101/2023.06.01.543285v4.
You will find in the attachement our answers to the reviewers as well our manuscript with track changes. We thank you for handling our manuscript and the reviewers for their helpful comments.
Best regards
Anne Roulin
Decision by Josep Casacuberta, posted 19 Jul 2023, validated 19 Jul 2023
Dears Drs. Midanakis and Roulin,
Thank you for submitting your article for consideration by PCI Genomics. Your article has been reviewed by two peer reviewers, and both feel that your article reports a valuable study, although both have minor comments and suggestions for improving the manuscript. Therefore, I would suggest you to revise the manuscript taking into account their comments. One referee thinks that the title does not describe well the content of the article, and I tend to agree that the scientific results obtained are not reflected in the title. Please, consider also this comment when revising the manuscript.
With best regards,
Josep M. Casacuberta
Reviewed by Thibault Leroy, 12 Jul 2023
In this manuscript, Minadakis et al. have assembled and analyzed an impressive dataset of >300 WGS of Brachypodium distachyon, a model grass species. By using a combination of population genomics and ecological niche modelling approaches, the authors aimed at (i) describing the population structure, (ii) exploring the demographic history of the inferred genetic groups, (iii) identifying their past ecological niches and (iv) investigating their adaptation to climate. Even if I am not an expert of all the methods used, I overall consider that the present work is done according to the state of the art and I have therefore no major concerns regarding the methodology (even if a few points should be clarified according to me, see my comments below). I have really enjoyed a lot reading the manuscript. The ms was prepared with care and was therefore particularly pleasant to read. A particular attention seem to have been given to the figures, which is also particularly enjoyable. I therefore have only relatively minor comments.
Minor comments:
Title : I consider that the current title does not really cover the study as whole. Even if I agree that the release of 71 new whole-genome sequences of B. distachyon represents a great resource for the community, I do not consider that this represents the main point of the paper.
l. 16-17: Just a minor point here considering the importance of the grass species. It could perhaps be meaningful to indicate that the grass species are also the main source of calories consumed by human beings and livestock !
l. 34: I suggest “in regions of selected genes” rather than “at selected genes”
l. 36: It could appear a bit disappointing to consider that the ultimate goal of performing environmental genomics approaches based on hundreds of WGS is to obtain “candidate genes for functional studies”. Of course, the functional validation of the detected genes is important, but I do not consider that this is the main point to highlight. I rather consider that these approaches allow to scan genomes without a priori and identify some genes that could be ecologically (or economically) relevant and that this work in Brachypodium could be viewed here as a crucial source of knowledge. These identified genes then allow more applied research, for instance by boosting translational research on the crop species, in order to develop novel varieties adapted to different climates (which is of course especially important in order to ensure sustainable agriculture in a global change context).
l. 44-45: “occurring in contrasting habitats” According to me, this sentence holds true for Fst scans, but I am not sure that this is accurate for the detection of selective sweeps in a single population (e.g. the reference to Nielsen et al. 2005).
l. 47: I do not agree that research on local adaptation in plants is dominated by A. thaliana. It could perhaps be considered true among herbaceous species (?), but I do not consider that this is valid for plants as a whole. Many studies have investigated local adaptation/ecological genomics in perennial species for instance.
l. 52: According to me, it seems difficult to cite Monroe et al. 2022 without indicating that this work has drawn considerable criticism from the community and that most of the results have been recently invalidated (e.g. see Liu & Zhang, 2022 MBE, Charlesworth & Jensen, 2023 MBE). It is probably better to not include this reference.
l. 52-58: I consider that this section is not super intelligible. The previous sentence focuses on studies in A. thaliana. And the sentence now starts by indicating that the development of pangenomes for the crop species will not help to understand adaptation in natural systems such as in Brachypodium. Even if I overall agree, I don’t see the point associated with the pangenomes. First, because there is no direct link between the pangenomes and the content of the paper, at least according to me. Second, because we can reasonably expect that some pangenome graphs will be available for Brachypodium relatively soon and then help to understand local adaptation in this species. I suggest to revise this paragraph as a whole.
l. 82: It could be relevant to provide more information about the work in Stritt et al. 2022 rather than to just indicate “but see Stritt et al. (2022)”. Even if I did not read this previous paper completely, this previous paper represents another remarkable piece of work. Consequently, I encourage the authors to discuss more their past research, in order to help the readers to better understand the advances made in the new study. Note that I appreciated the fact that the authors took care to use the same color code than in their previous study.
l. 100-101 (Table S1): No information regarding the number of reads or the coverage seems to be shown in Table S1. In addition, for each sample, it could be helpful to add the country of origin in this supplementary Table S1, since the authors often refer to the different countries in the ms, but the Table S1 only reports the GPS coordinates, which is not convenient.
l. 109: As far as I understand, there is no sample from Israel in the dataset, isn’t it? If so, I think it should be more explicitly indicated. For instance, this could be indicated as follows “...is extremely rare in Israel. Despite considerable effort to collect individuals from the genus Brachypodium in Israel (Wilson et al. 2019), no B. distachyon samples from Israel has been identified and are therefore included in this study. In France, ... ”
l. 115 -118 (+l. 370-380). For most of the population genomics analyses, a pruned set of SNPs has been used. Could the authors explain why a dedicated SNP set of 75k randomly selected SNPs has been used for this specific analysis? For the sake of clarity, I think this information should be explicitly provided to the readers.
l. 115 -118 (+Fig. S2): It could be quite confusing to observe that the pattern of branching among the 3 groups, as shown in the Fig. S2, is different from the one expected from Stritt et al. 2022 and assumed for the multispecies coalescent approach. I guess here the authors consider that the branching should not be overinterpreted since it is only based on a hierarchical clustering. Consistently, I encourage the authors to not show such a tree and to highlight the absence of bias based on another analysis, e.g. by using the results of the PCA rather than the tree for instance.
l. 120 – 122 (+ Fig. 1a, b): Regarding the map and the PCA, I found the black dots particularly difficult to read, mostly because of the limited contrast with the dark blue ones. I think a different color could be used for these samples. Regarding the map, some numbers are shown (at least for most dots), but I was unable to understand to what they correspond. Could you also explain this in the figure caption (or remove these numbers if not needed)?
l. 122-124 (+Fig. S3). Considering the Evanno ad hoc test, a likelihood-derived deltaK values lower than 10 or 20 could be considered as a very low support for a “best” group. Here I think the values should not be interpreted like that, when the test is not based on likelihood values. The figure caption could perhaps indicate that the low deltaK values should not be interpreted as a low support, since the range of DeltaK values is expected to be different based on the cross-entropy values than those directly computed on the likelihood estimates. In addition, one crucial aspect of the deltaK is to consider the standard deviation among replicates, but here no information is shown regarding the confidence interval on Fig. S3b? Even the value currently shown for each K is unclear to me, is it the average value, the median or lowest cross-entropy per K?
l. 125-129: Some sentences are a bit too long in the main text. For instance, this sentence could be easily split into two to improve the readability of this paragraph, e.g. “… with the main Italian clade (A_Italia). Four accessions from Spain have… “
l. 139-143 (+ 415-416): The authors used a mutation rate of 7x10⁻⁹ to scale coalescent time to real time and to interpret the results with regards to the past climate. To justify the use of this value, the authors cite Lynch and collaborators (2016, l. 395). I was unfortunately unable to find the corresponding mutation rate (at least for a Brachypodium species) in this paper (sorry if this is my fault). But given the importance of the mutation rate in the analysis, I consider that this should be clarified. Similarly, I am wondering how accurate is a generation time of one year for this species. Can we consider that the seed viability is too low in Brachypodium in such a way that a generation per year is mandatory? At least, I think it could be important to 1) consider the confidence interval of the mutation rate (at least) rather than a single (mean?) value and 2) discuss the uncertainties of the estimates (at least a bit more than in lines 157-158).
l. 149-151. I have no experience with Relate, but I am bit surprised of the explanation provided here in the ms. The skyline plot of the B_East population suggests a particularly marked bottleneck in this population as compared to the other populations. My bet would be that this had a more pronounced effect on the present-day levels of diversity and Tajima’s D, but the authors have rather observed the opposite on this population and considered that this could be associated to the absence of a more ancient bottleneck in this B_East population as compared to the others populations. I should admit that I remain a bit skeptical with this interpretation. Could the authors provide more details regarding their interpretation?
l. 273-275 (+ l. 506-508): The authors have made the choice of using a quantile (0.999) on the empirical distribution of the XtX.
First, this choice is debatable since the authors do not know the true proportion of the genome that is under selection. That’s why it is rather recommended to use some pseudo-observed datasets (PODS) assuming neutrality to calibrate the Fst or Fst-like distribution (e.g. as typically suggested for the XtX and the BF under BayPass). The authors argue that the strategy they used was “more conservative than the threshold calculated with a pseudo-observed dataset”. Here I am wondering if they have properly evaluated though PODs on their dataset or if they assume that this to be true in general.
Second, the authors indicated in the Materials and methods that they have used all SNPs from the vcf for Baypass and selected the top 0.1% outliers. Following this, I would have expected around 10,200 SNPs to be identified (10,227,760 * 0.1%)? In the main text, they indicated that they have revealed 1477 “genes”. I am a bit confused here, should we understand that they have filtered SNPs falling in genes before to identify the top 0.1% ? This section could probably be clarified.
l. 353-355: I am not sure that this is the best position in the ms to provide this information, since these additional samples are not included in the analysis but are only shown on the map. According to me, it could make more sense to provide this information in the caption of the corresponding figure.
l. 358-367: The code associated with the bioinformatic part is not provided on github. The availability of all the code is crucial for any publication, but this is even more important considering a manuscript peer-reviewed for PCI (since it is considered as a prerequisite for a recommendation). In addition, I am not fully convinced that the current repository is sufficiently well-organized and provides sufficient information to allow a reader to reproduce all the work done by the authors. An additional effort on this github repository would be particularly appreciated (at least on the readme.md file). It could also help the authors to not forget a step in the pipeline (e.g. I guess a read trimming has been performed by the authors). In addition, it could be useful to help the reader to understand why the authors have made the choice of using vcftools rather than GATK VariantFiltration.
Fig. 1C (caption): properly speaking this is not a Structure plot. Perhaps better to indicate “Inferred individual admixture coefficients under sNMF...”
Fig. S5: I am wondering if it could not be interesting to also include the population structure (e.g. PCA axes, admixture coefficients) in the correlation plots in addition to the 32 bioclimatic variables.
https://doi.org/10.24072/pci.genomics.100251.rev11
Reviewed by anonymous reviewer 1, 06 Jul 2023
Minadakis et al complete the geographical sampling of Brachypodium distachyon by adding 71 genotyped accessions from Greece and Montenegro to reach a total number of n=332 genomic datasets with an average 10X depth. Their population stratification analysis still supports the K=5 populations originally reported by Stritt in 2022.
1) Can those 10x data be used to assembly nuclear contigs or at least chloroplast genomes as done by Sancho et al?
2) Figure 1d legend, please explain why only 4 clades are indicated, not 5.
3) Did the authors compute Fst among the 5 populations? It would be useful to see those values in the context of the values reported by Gordon et al and Figure 1e.
4) L180 "minimum temperature averaged from November to February (hereafter tmin_Nov-Feb) was chosen as potentially important for the vernalization process" -> I would generally agree with this choice of months, but please note that at least in the Iberian peninsula you can have frosts in march and april, which have a cost on cereal yields.
5) L326 "Because we filtered SNPs with more than two alleles, we may have generally excluded such genetic factors from our analyses" -> is it not possible to repeat this part of the analysis with multiallelic SNPs in?
6) I think the section on associated genes would benefit from checking out some known controls. For instance, the authors mention "flowering time"; it would be reassuring to see whether well known flowering control genes have different alelles correlation with variables such as latitude or altitute. For instance, in barley it is well known that VRN1 alleles follow a latitudinal cline, or that CBF alleles correlate with cold temperatures.
https://doi.org/10.24072/pci.genomics.100251.rev12


