
Advancing our understanding of poplar growth using a multi-omics approach
Natural variation in chalcone isomerase defines a major locus controlling radial stem growth variation among Populus nigra populations
Abstract
Recommendation: posted 03 April 2025, validated 30 April 2025
Pootakham, W. (2025) Advancing our understanding of poplar growth using a multi-omics approach. Peer Community in Genomics, 100422. 10.24072/pci.genomics.100422
Recommendation
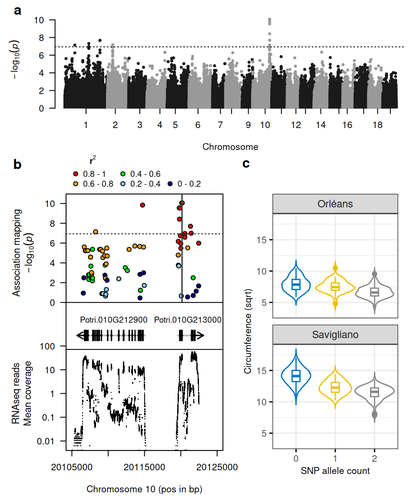
Poplar is a promising resource, valued not only for wood production and the development of lignocellulosic biomass, but also for its potential role in carbon sequestration. Recognizing the importance of stem growth for wood production and biomass development, Duruflé et al. (2025) present a comprehensive study on the genetic basis of radial stem growth variation in natural populations of black poplar (Populus nigra). They employed a systems biology approach to identify the quantitative trait loci (QTLs) underlying this trait, integrating genomic, transcriptomic, and phenotypic data from a large collection of poplar genotypes. Their genome-wide association study (GWAS) analysis identified single nucleotide polymorphisms linked to two gene models predicted to encode chalcone isomerase, an enzyme involved in the flavonoid pathway. The authors then used the RNA-seq data to test whether the expression of the candidate genes correlated with the phenotypes, and indeed the level of expression of both genes displayed a correlation to the stem circumference. To support their findings, the authors compared the location of the QTLs detected in this study with previously published QTLs. Interestingly, they found a previously reported QTL co-localizing with the newly identified one. The authors have addressed the concerns raised by reviewers on the GWAS analysis and discussed the complication of this QTL study in the manuscript.
In essence, the authors have combined the power of GWAS and transcriptomics to locate candidate genes and applied population genetics to explore the evolutionary context of the identified gene. This comprehensive approach provides strong evidence for the role of chalcone isomerase in controlling radial stem growth variation in black poplar. The study opens up avenues for further research into the precise mechanisms by which chalcone isomerase and flavonoid metabolism influence stem growth and provides useful information for future poplar breeding programs.
References
Duruflé H, Déjardin A, Jorge V, Pégard M, Pilate G, Rogier O, Sanchez L, Segura V (2025) Natural variation in chalcone isomerase defines a major locus controlling radial stem growth variation among Populus nigra populations. bioRxiv, ver. 3 peer-reviewed and recommended by PCI Genomics. https://doi.org/10.1101/2024.10.21.618920

The recommender in charge of the evaluation of the article and the reviewers declared that they have no conflict of interest (as defined in the code of conduct of PCI) with the authors or with the content of the article. The authors declared that they comply with the PCI rule of having no financial conflicts of interest in relation to the content of the article.
ANR-13-JSV6-0001 (SYBIOPOP) ; ANR-10-LABX-0040-SPS (LabEx Saclay Plant Sciences-SPS)
Evaluation round #1
DOI or URL of the preprint: https://doi.org/10.1101/2024.10.21.618920
Version of the preprint: 2
Author's Reply, 06 Feb 2025
Decision by Wirulda Pootakham, posted 16 Dec 2024, validated 16 Dec 2024
Dear Authors,
After your manuscript has been peer-reviewed by two reviewers in the field, they both provided constructive suggestions on how to improve the quality of this manuscript. We believe that a revision that takes those recommendations into account will yield a manuscript that is suitable for publication in PCI Genomics.
Please include the following items when submitting your revised manuscript:
- A rebuttal letter that responds to each point raised by the reviewer(s).
- A marked-up copy of your manuscript that highlights changes made to the original version.
We are looking forward to receiving a revised copy of the manuscript.
Regards,
Wirulda Pootakham
Reviewed by anonymous reviewer 1, 14 Dec 2024
Title and abstractDoes the title clearly reflect the content of the article? [X ] Yes, [ ] No (please explain), [ ] I don't know
Does the abstract present the main findings of the study? [X ] Yes, [ ] No (please explain), [ ] I don’t know
IntroductionAre the research questions/hypotheses/predictions clearly presented? [ ] Yes, [X] No (hypotheses must be indicated explicity), [ ] I don’t know
Does the introduction build on relevant research in the field? [X ] Yes, [ ] No (please explain), [ ] I don’t know
Materials and methodsAre the methods and analyses sufficiently detailed to allow replication by other researchers? [ ] Yes, [X ] No (More information is required. See specific comments), [ ] I don’t know
Are the methods and statistical analyses appropriate and well described? [X ] Yes, [ ] No (please explain), [ ] I don’t know
ResultsIn the case of negative results, is there a statistical power analysis (or an adequate Bayesian analysis or equivalence testing)? [ ] Yes, [X ] No (please explain), [ ] I don’t know
Are the results described and interpreted correctly? [X ] Yes, [ ] No (please explain), [ ] I don’t know
DiscussionHave the authors appropriately emphasized the strengths and limitations of their study/theory/methods/argument? [ X] Yes, [ ] No (please explain), [ ] I don’t know
Are the conclusions adequately supported by the results (without overstating the implications of the findings)? [ ] Yes, [ X] No (please explain), [ ] I don’t know
REVIEW
In their work, the authors analyze the relationship between variants associated with the chalcone isomerase gene and the diversity existing among different Populus nigra accessions and its effect on diameter growth. Their system biology analysis approach considered integrating phenotypic and transcriptomic data, GWAS, and population genetics analyses. The subject and the approach developed by the authors are very interesting, given the importance of P.nigra, and the need to characterize the mechanisms that control growth traits. Overall, the manuscript is well-structured and well-written. However, the authors must improve some methodological aspects to complement the information provided and the interpretation of the results obtained. My main concerns deal with how the analyses handled the genetic structure of the association population, the lack of correction of false positives in the analyses, and the very high phenotypic variation explained by individual SNPs.
Specific comments
Title:
-The concept of “growth” should be more specific. Radial stem growth was studied.
-Replace “between” with “among”.
Introduction:
-This section should be complemented with information about the candidate genes on which the analyses were done.
-The hypothesis that guided the study should also be made explicit.
Materials and Methods:
-L131-132. Please include the geographical coordinates for ORL and SAV here (It should be optional to search for this information in other articles).
-L135-136. Briefly explain the criteria used to select this subset of genotypes.
-L140. Indicate why the climatic data from that particular range was included.
-L142-143. Indicate how much of the total variation was explained by PC1 and PC2.
-L146. About the concept of “circumference,” please explain here what specifically is referred to: perimeter, radius, or diameter. Usually, in forestry studies, the latter is used. Please also indicate how it was measured.
-L146. Please check or explain the concept of “Infraden”.
-L156. Clarify if the square root transformation was used for circumference and basic density.
-L167. Indicate the source/platform where this genomic sequence was available. Phytozome?
L178-179. Describe which specific callers were used.
Include a description of the variance partitioning models mentioned in Figure 3.
L195-L196. Describe how these variance and covariance components were obtained.
L196. Explain the type of genetic relationship that was considered for obtaining the kinship matrices. IBD, IBS, other?.
L195-L196. Describe how these variance and covariance components were obtained.
L198. Clarify why two kindship matrices were averaged if the association population was only one (the same set of accessions was established in two common garden trials).
-L200-L203. Please add a Hardy-Weinberg test for the SNPs analyzed. It is important to know whether these markers are in gene equilibrium and to determine if they are neutral or reflect some adaptive process.
-L205. “...GWAS was performed for circumference in each site with genotypic adjusted means...” Explain why basic density was not considered in these analyses.
-L205-L213. Indicate if the association models included any factors to model population structure (Q-matrix). If not, explain why.
Describe how the percentage of phenotypic variation that accounted for the significant SNPs was calculated.
From what was described, a test to control for false positives (e.g., FDR, Bonferroni) was not applied. It is essential to do this test to validate the character-SNP associations identified as significant. Please include it.
L214-215. “...GWAS were also carried out using transcriptomic data (eQTL analysis) but focusing only on two genes of particular interest in this work...” Explain how these two genes were chosen or from which analysis they came.
L220. “...parental population of P. nigra...”. Explain if there is any relationship with the accessions used for the GWAS.
L223. “...using a simple linear model...”. Describe what this model consisted of.
Results:
L227-229. At this point, the specific density should be mentioned.
L230-231. “...Potri.010G212900, annotated as a Beta-Hexosaminidase 1 (Hexo1)...”. Check this annotation. It seems that is not the one currently in Phytozome13 for Ptricho3.0.
-L234-236. More than 20% or 50% of the phenotypic variance is very high for an individual SNP, considering that girth is a continuous/metric/complex trait. Please elaborate on “without accounting for population structure” and its relation to such percentages.
- L235. “...Although not significant in the ...”. Indicar el umbral de significancia estadística (alfa).
-Incorporate a reference to the Hexo1 gene.
Figure 1:
- Indicate what “r2” means at the top of panel b).
- In panel c), indicate the molecular genotype associated with codes “0”, “1” and “2”.
- Replace the coefficient of determination “R2” with the correlation coefficient “r” to be consistent with the concept of correlation used in the text. Also, add the p-value for each coefficient.
-L261-269. Rewrite using the correlation value “r” instead of “R2”, which, although associated, represents the coefficient of determination. Otherwise, the level of relationship between both variables is underestimated.
Figure 2:
-Panels a) and b). Indicate the correlation coefficient instead of the determination coefficient. Add the p-value for each coefficient. Add the title and unit to the x-axis. For clarity, replace gene model names with gene codes (CHI or Hexo1).
-Panels c) and d). For clarity, replace gene model names with gene codes (CHI or Hexo1).
- In the description of the figure, and concerning “...The expression level of transcripts have been standardized with a genetic analysis...”, briefly mention what type of analysis you are referring to.
L293-294. “...Interestingly, when the top SNP was included as a fixed effect in this variance partitioning model, it explained up to 24% of the total phenotypic variance...”. Usually, when a factor is defined as fixed within a model, its variance is a constant (a specific numerical value), and it has no associated variance component (this is only estimable for random factors). Please explain how this contribution to the total variance was estimated.
Figure 3:
What is described at the bottom of the figure should be mentioned in detail in the Materials and Methods section.
Figure 4:
Add the units for the Y-axis variables for panels a), b), and c).
Figure 5:
For panels a), b) and c), indicate the correlation coefficient instead of the coefficient of determination.
Discussion:
-L357. “...We made use of growth data collected...”. specify that growth data are referred to stem diameter/circumference. Please include a supplementary table with the range of values (untransformed) and averages for the accessions evaluated (grouped by origin/populations).
-L371-381. Include a mention of the fact that circumference measurements and transcriptomic analyses were performed on trees of different ages.
-L382-388. Explain why models with a factor for population structure (Q matrix) were not considered.
-L393. Indicate the meaning of the acronym “GRM”.
-L409-414. Please include in this part of the discussion the fact that some of the top SNPs (Table S1) are part of nucleotide triplets that correspond to stop codons (Chr10-20120172) or involve nucleotides very close to them (Chr10-20120195). When using Phytozome tools to explore the CHI gene (Potri.010G213000), it can be seen that there are two alternative transcripts for that gene: Potri.010G213000.3 and Potri.010G213000.2. The latter is shorter (the last exon would be missing), most likely due to the presence of SNPs related to stop codons, which would imply that a variant is associated with a truncated and probably non-functional protein.
-L417-422. The results discussed here should also have been mentioned in the Results section.
Reviewed by Gancho Slavov , 02 Dec 2024
This is a well written manuscript based on what looks like a carefully collected and extensive data set. The crux of the paper are the GWAS and eQTL analyses, and I have a few technical questions, the answers to which will largely determine my overall assessment:
1) As the authors acknowledge in the Introduction, there is strong population structure in black poplar. What exactly was done to control for that, as well as for confounding caused by the presence of close relatives, in the GWAS analysis? I am assuming the authors used standard mixed linear model methodology, including a kinship matrix and principal components, but this needs to be spelled out.
2) How much confounding was still left after applying the methodology referenced in 1)? As a minimum, QQ plots and/or lambda (mean genomic control test statistic) need to be reported.
3) Similar questions about the eQTL analysis…
4) The Fst analysis and correlations to climate/geography do very little to reassure me that this association is not an artifact of population structure. There are likely to be thousands of SNPs with similar properties across the black poplar genome (https://www.biorxiv.org/content/10.1101/2024.10.11.617670v1). Would the association hold in a within-population analysis? Is the PVE realistic given what is known about Beavis effects and complex traits?


